Car Insurance Fraud Detection
Ensemble-based approach to detect fraudulent car insurance claims with high specificity.
Introduction
Problem Statement
본 프로젝트는 DACON에서 주최한 차량 보험 사기 예측 해커톤의 일환으로 수행되었다. 주요 목표는 기존 보험 청구 데이터를 기반으로 사기 가능성이 높은 사례를 분류하는 것이며, 이진 분류 문제로 접근하였다. 특히, 사기 탐지(fraud detection) 문제의 특성 상 특이도(Specificity) 즉, 정상인 데이터를 얼마나 정확히 판별하는지가 중요하며, 이 지표를 최적화하는 방향으로 모델을 설계하였다.
Dataset
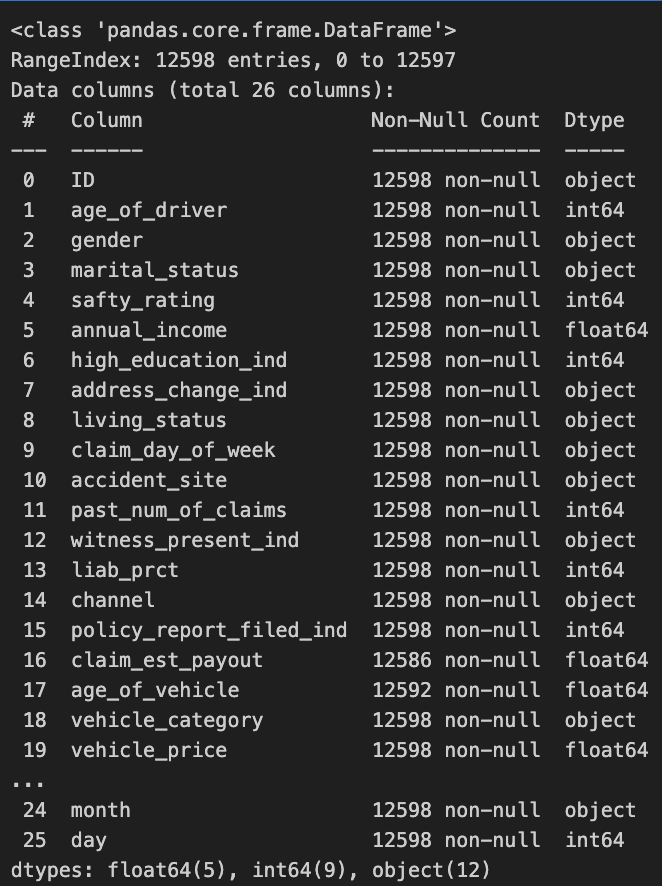
본 해커톤에서 제공한 학습 데이터 셋은 약 1만 3천개의 보험 청구 기록 데이터와 25개의 피처가 포함되었다. 이 중 수치형, 범주형 피처가 혼합되어 있으며. 일부 피처는 불균형 분포와 결측치를 포함하고 있다.
피쳐 정보 ID : 고유ID age_of driver : 운전자 나이 gender : 운전자 성별 marital_status : 결혼 상태 safty_rating : 운전자의 안전점수 annual_income : 연간소득(단위:달러) high_education_ind : 운전자의 학력 address_change_ind : 운전자의 주소변경 여부 living_status : 자동차 소유상태 claim_day_of_week : 청구된 접수된 요일 accident_site : 사고 발생 지역 past_num_of claims : 과거 청구 건수 witness_present_ind : 목격자 여부 liab_prct : 운전자 과실 비율(%) channel : 청구 접수 매체 policy_report_filed_ind : 경찰 신고 접수 여부 claim_est_payout : 보험금 지급 추정 비율(%) age_of_vehicle : 자동차 연식 vehicle_category : 자동차 카테고리 vehicle_price : 자동차 가격(단위:달러) vehicle_color : 자동차 색깔 vehicle_weight : 자동차 무게(kg) fraud : 사기여부 year : 청구(년) month : 청구(월) day : 청구(일)
Process
본 프로젝트의 전체 수행 프로세스는 다음과 같다.
- EDA : 데이터의 구조, 분포, 이상치 및 결측치 파악
- Feature Engineering: 의미 있는 변수 생성, 범주형 인코딩, 스케일링 등
- Modeling Strategy: XGBoost, CatBoost, LightGBM 등 앙상블 기반 모델 적용
- Fitting & Tuning: Optuna 기반 하이퍼파라미터 튜닝, Soft Voting 앙상블 구성
- Evaluation & Analysis: Specificity 중심의 평가 지표 분석 및 중요 변수 해석
EDA

IQR, VIF를 포함해 Z-score 기반 정규화 후 분포를 확인한 결과 다수의 변수에서 극단적 이상치가 존재함이 확인되었다. 다만 이상치라고 판단하기보다는 좌/우로 편향된 값으로 판단하는게 옳다고 생각하여 이상치에 대한 직접적인 스케일링 보다는 피처 엔지니어링을 통해 해결하고자 하였다.
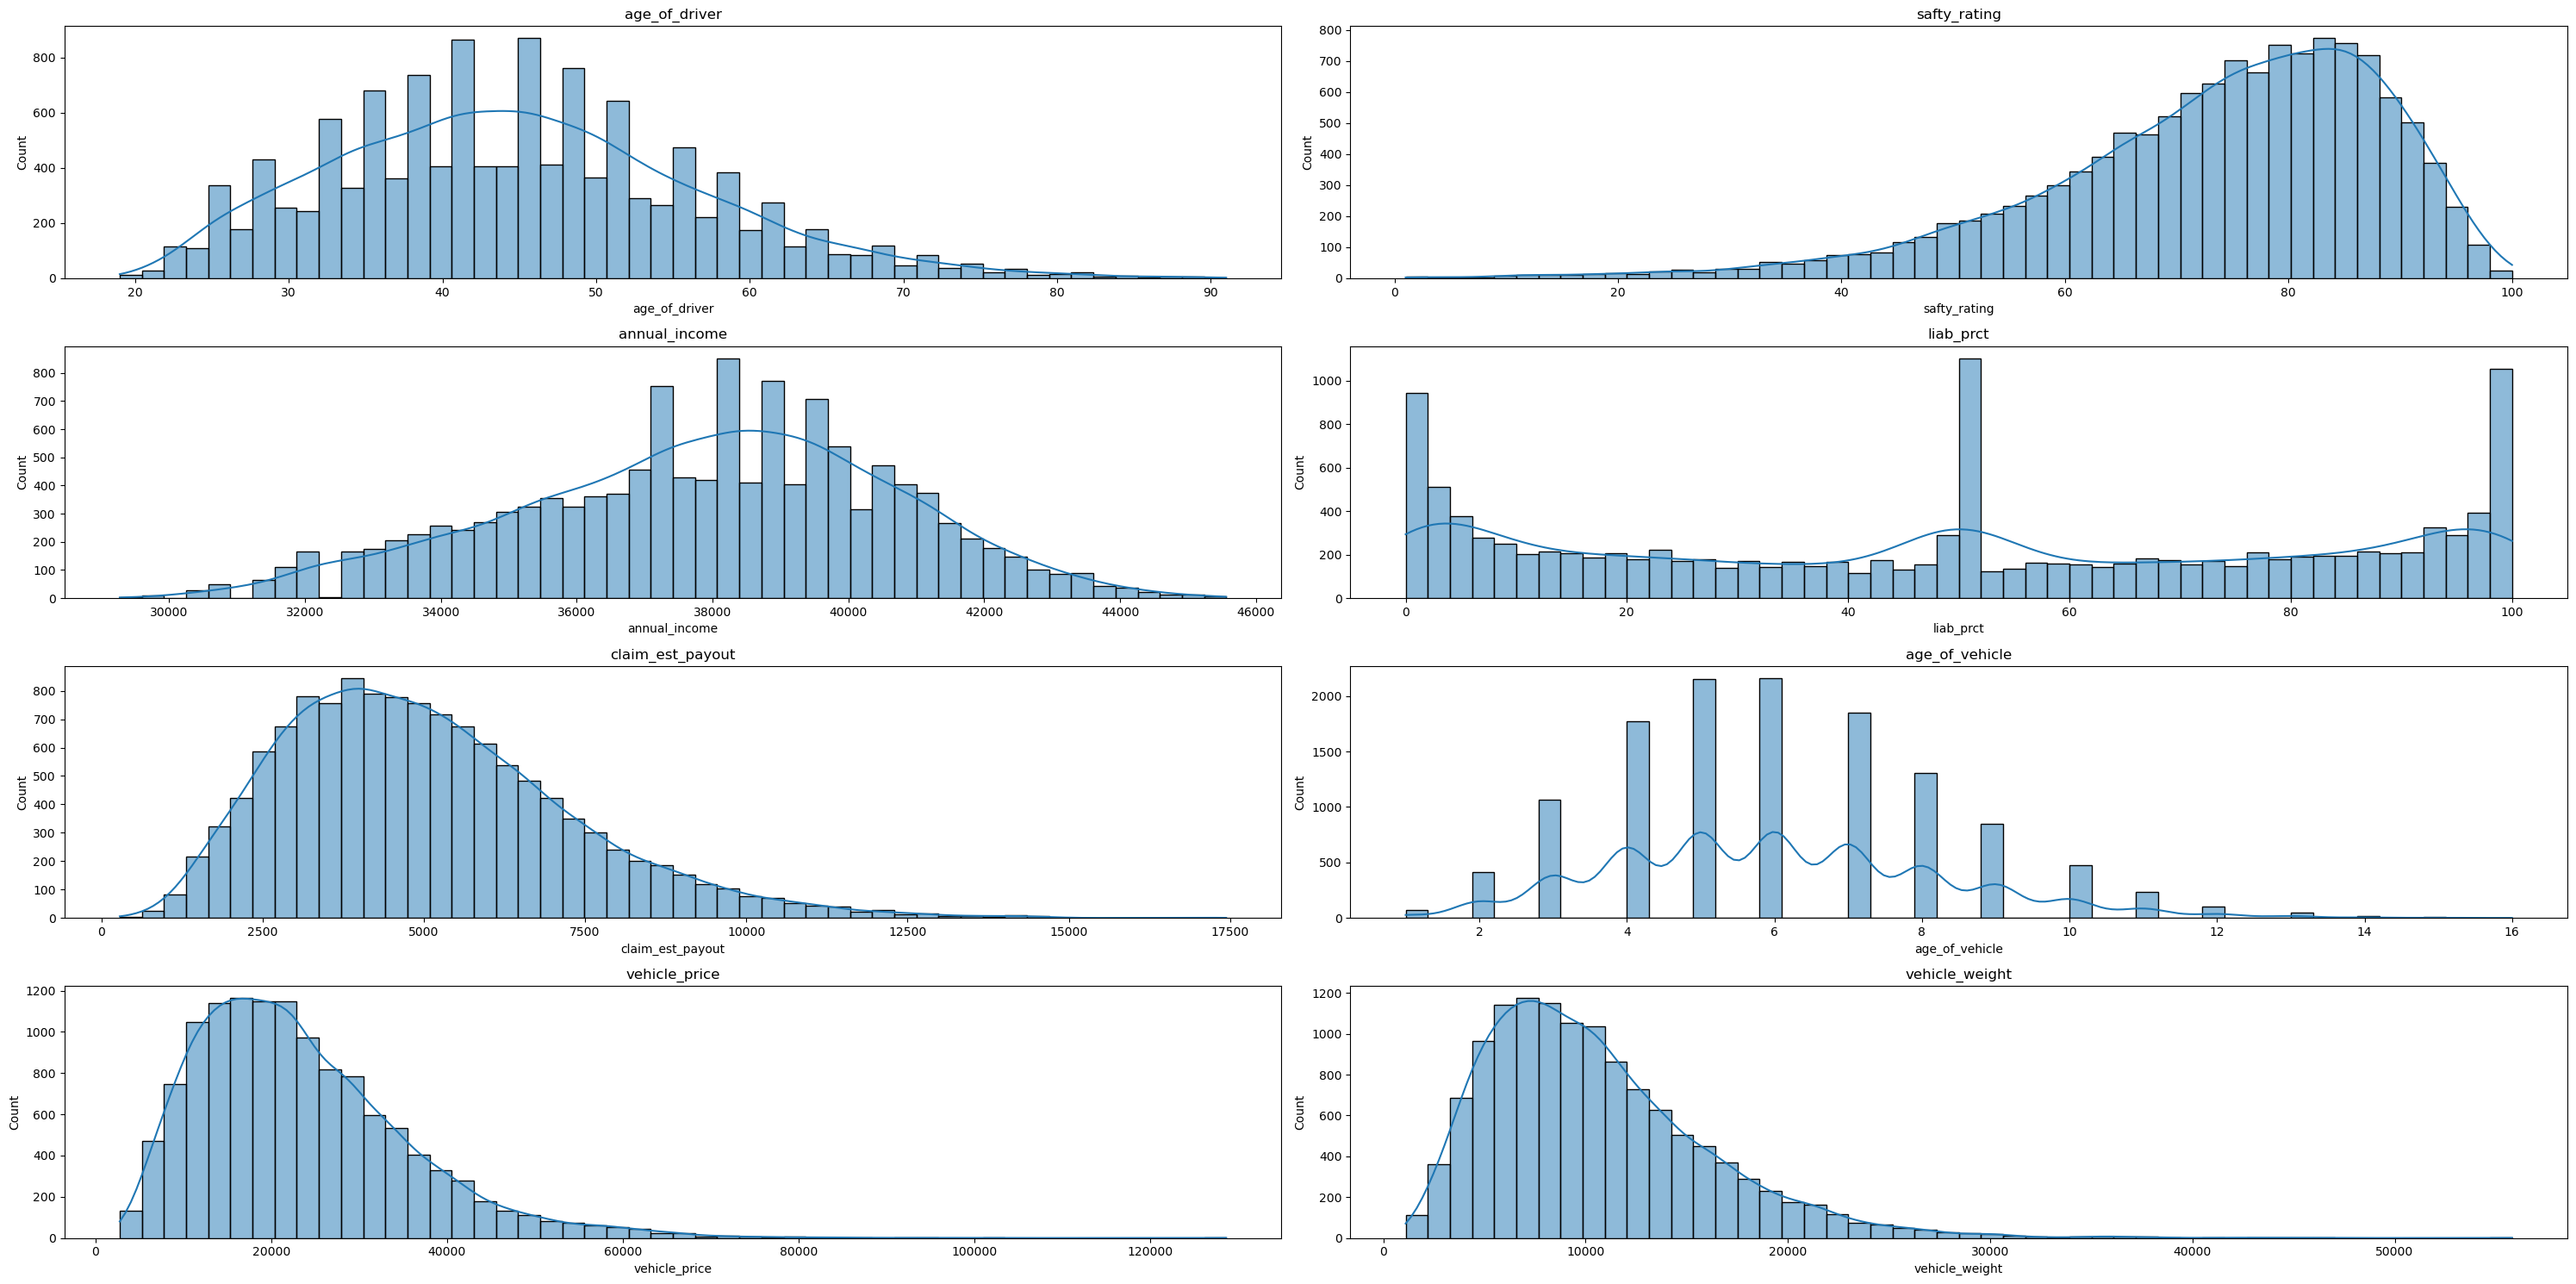
age_of_driver, annual_income, claim_est_payout 등 주요 연속형 변수들은 전반적으로 비대칭적 분포를 나타내며 liab_prct는 0%, 50%, 100%와 같이 특정 값에 급격히 몰리는 경향이 있으며, age_of_vehicle 역시 5~7년 사이에 밀집되어 있다. 이상치 및 왜도를 고려하여 스케일링과 변환이 필요한 변수들이 존재하며, 분포 기반 정규화 전처리 작업이 필요하다.
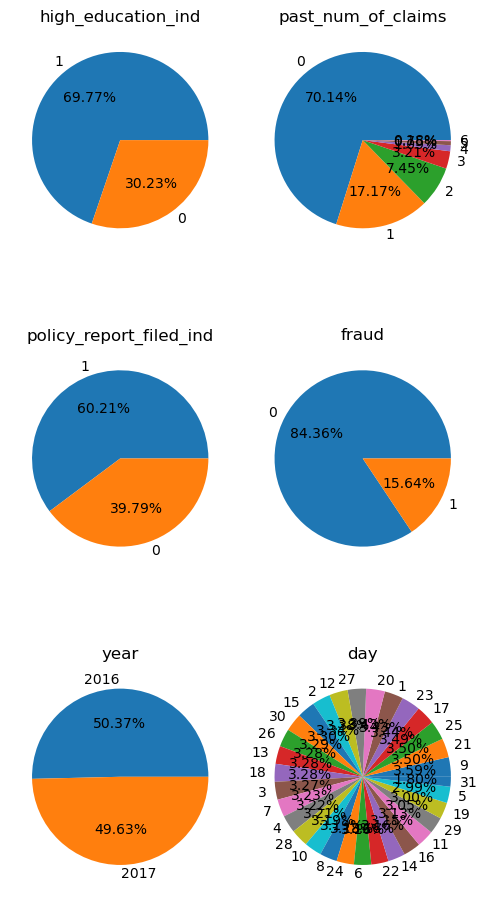
Target 피처인 fraud 레이블은 85:15의 불균형한 이진 분포를 보이며 일부 피처들은 특정 수치에 치우쳐져있음을 알 수 있다. year나 day같은 날짜 관련 변수는 비교적 균등하게 분포해있다. 클래스 불균형으로 인해 SMOTE나 threshold 조정등의 방법이 필요하다. 다만 트리 모델을 사용하여 앙상블을 적용할 예정이므로 SMOTE대신 threshold 조정으로 이를 극복하고자 한다.
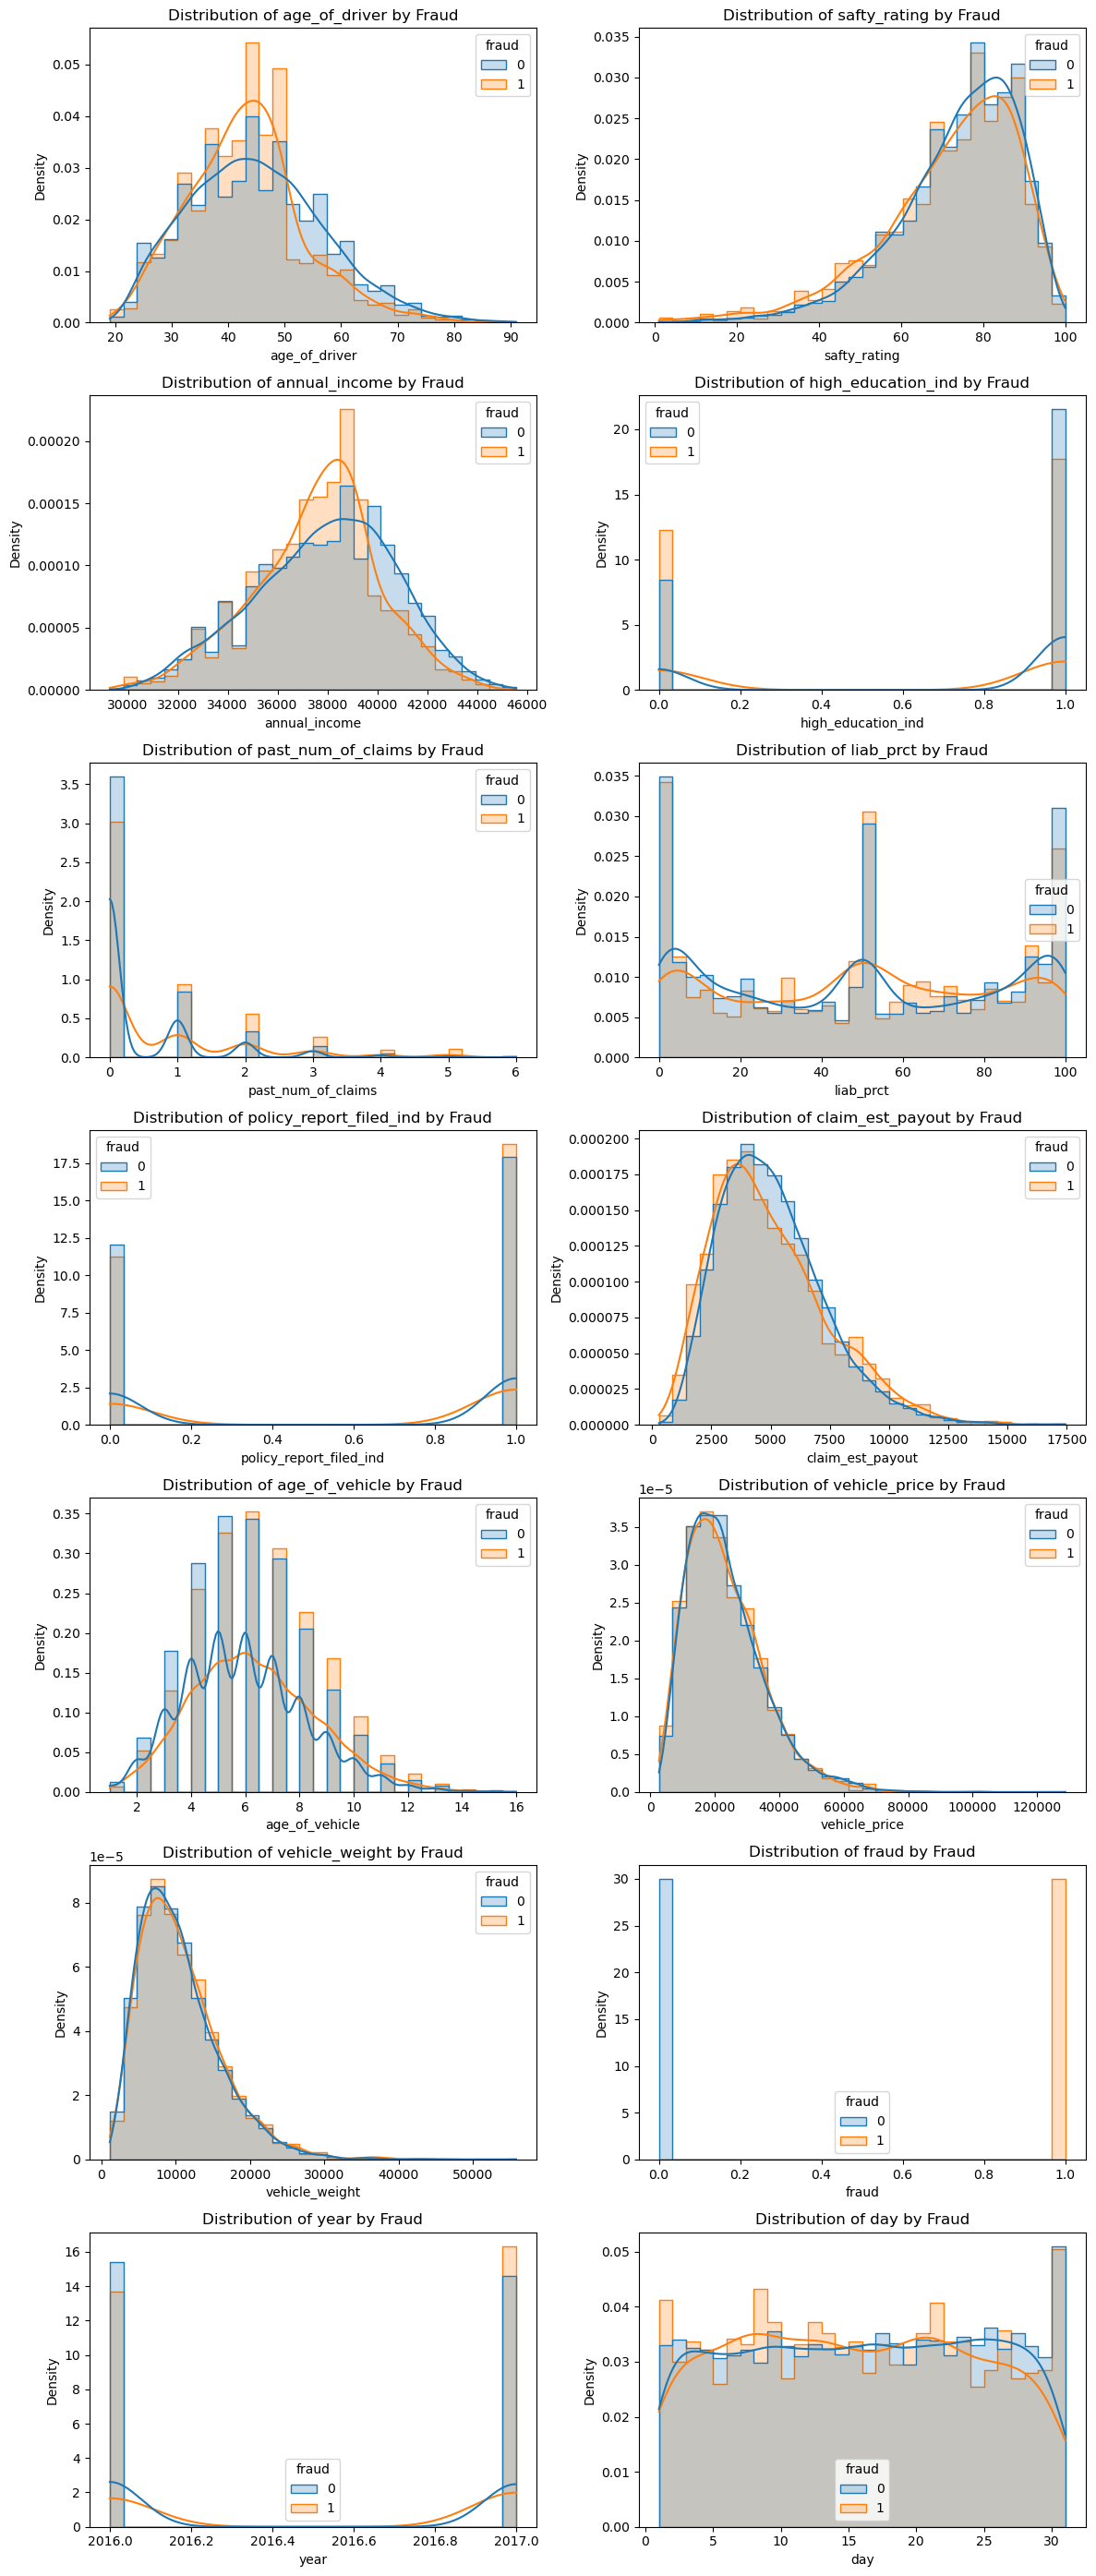
age_of_driver, annual_income, claim_est_payout에서 사기 건수는 약간 오른쪽으로 치우친 경향을 보인다. 플롯을 통해 일부 피처는 fraud와의 상관관계를 보이며, 특히나 보험료 추정액과 책임 비율이 타겟 변수와 강한 연관을 가진다.
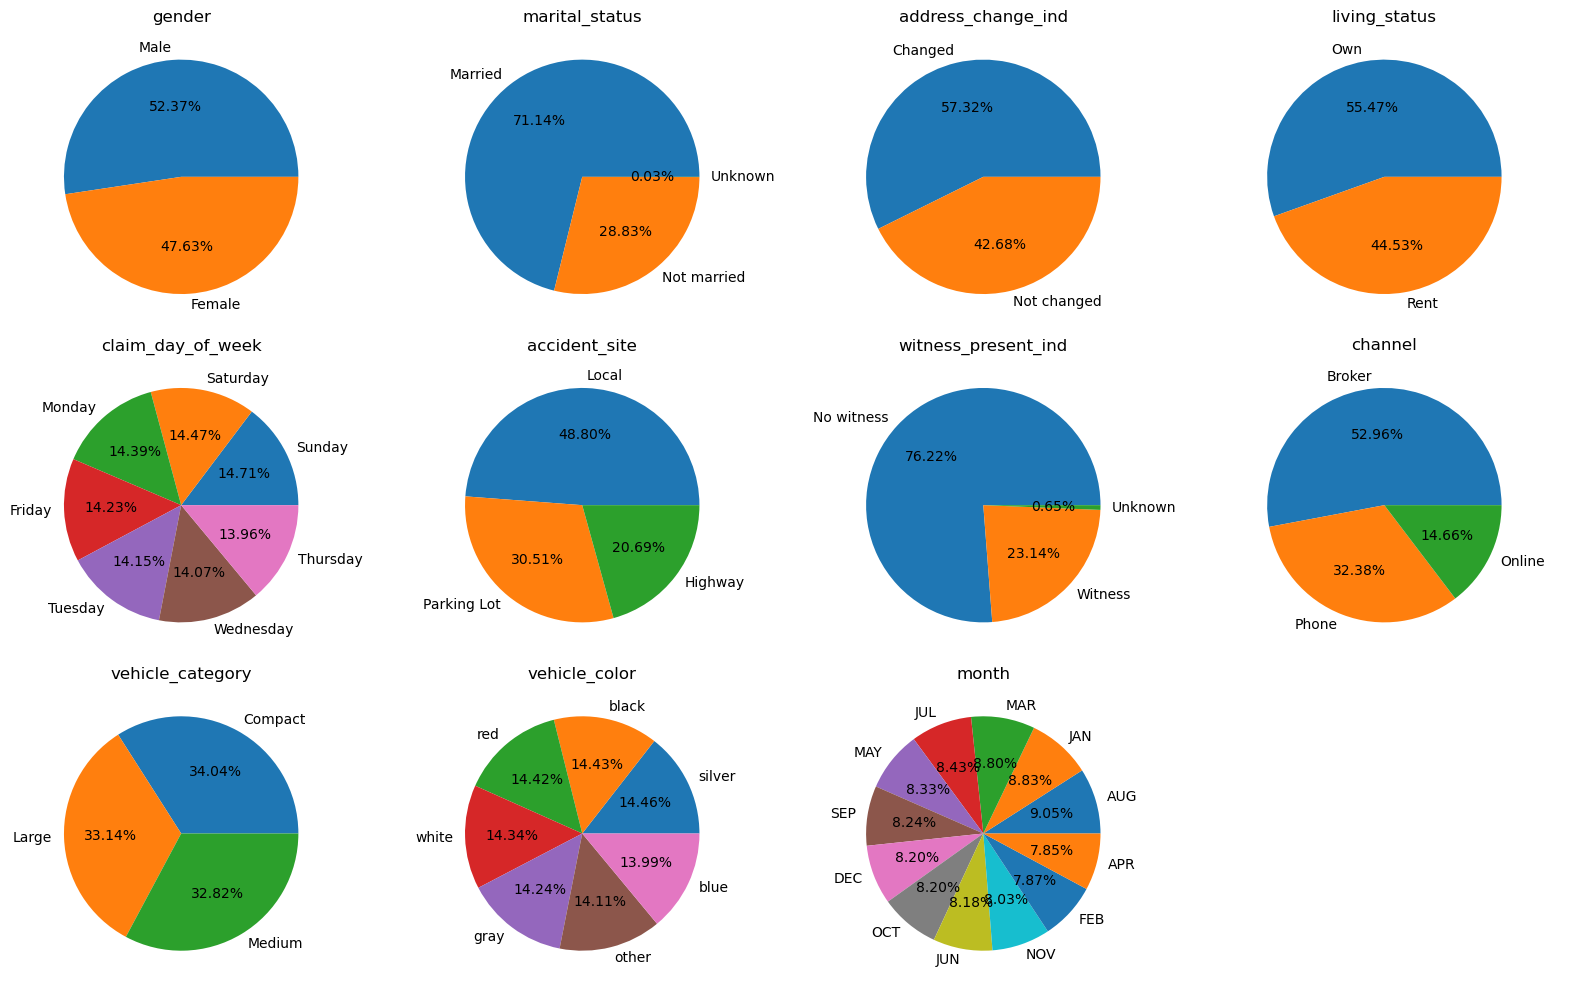
대부분의 범주형 변수들이 대체로 2~3개 수준의 고유값을 가지며 비교적 균형 잡힌 분포를 보여주지만, witness_present_ind, channel 등은 한 두 개의 값에 매우 치중된 분포를 갖는다.
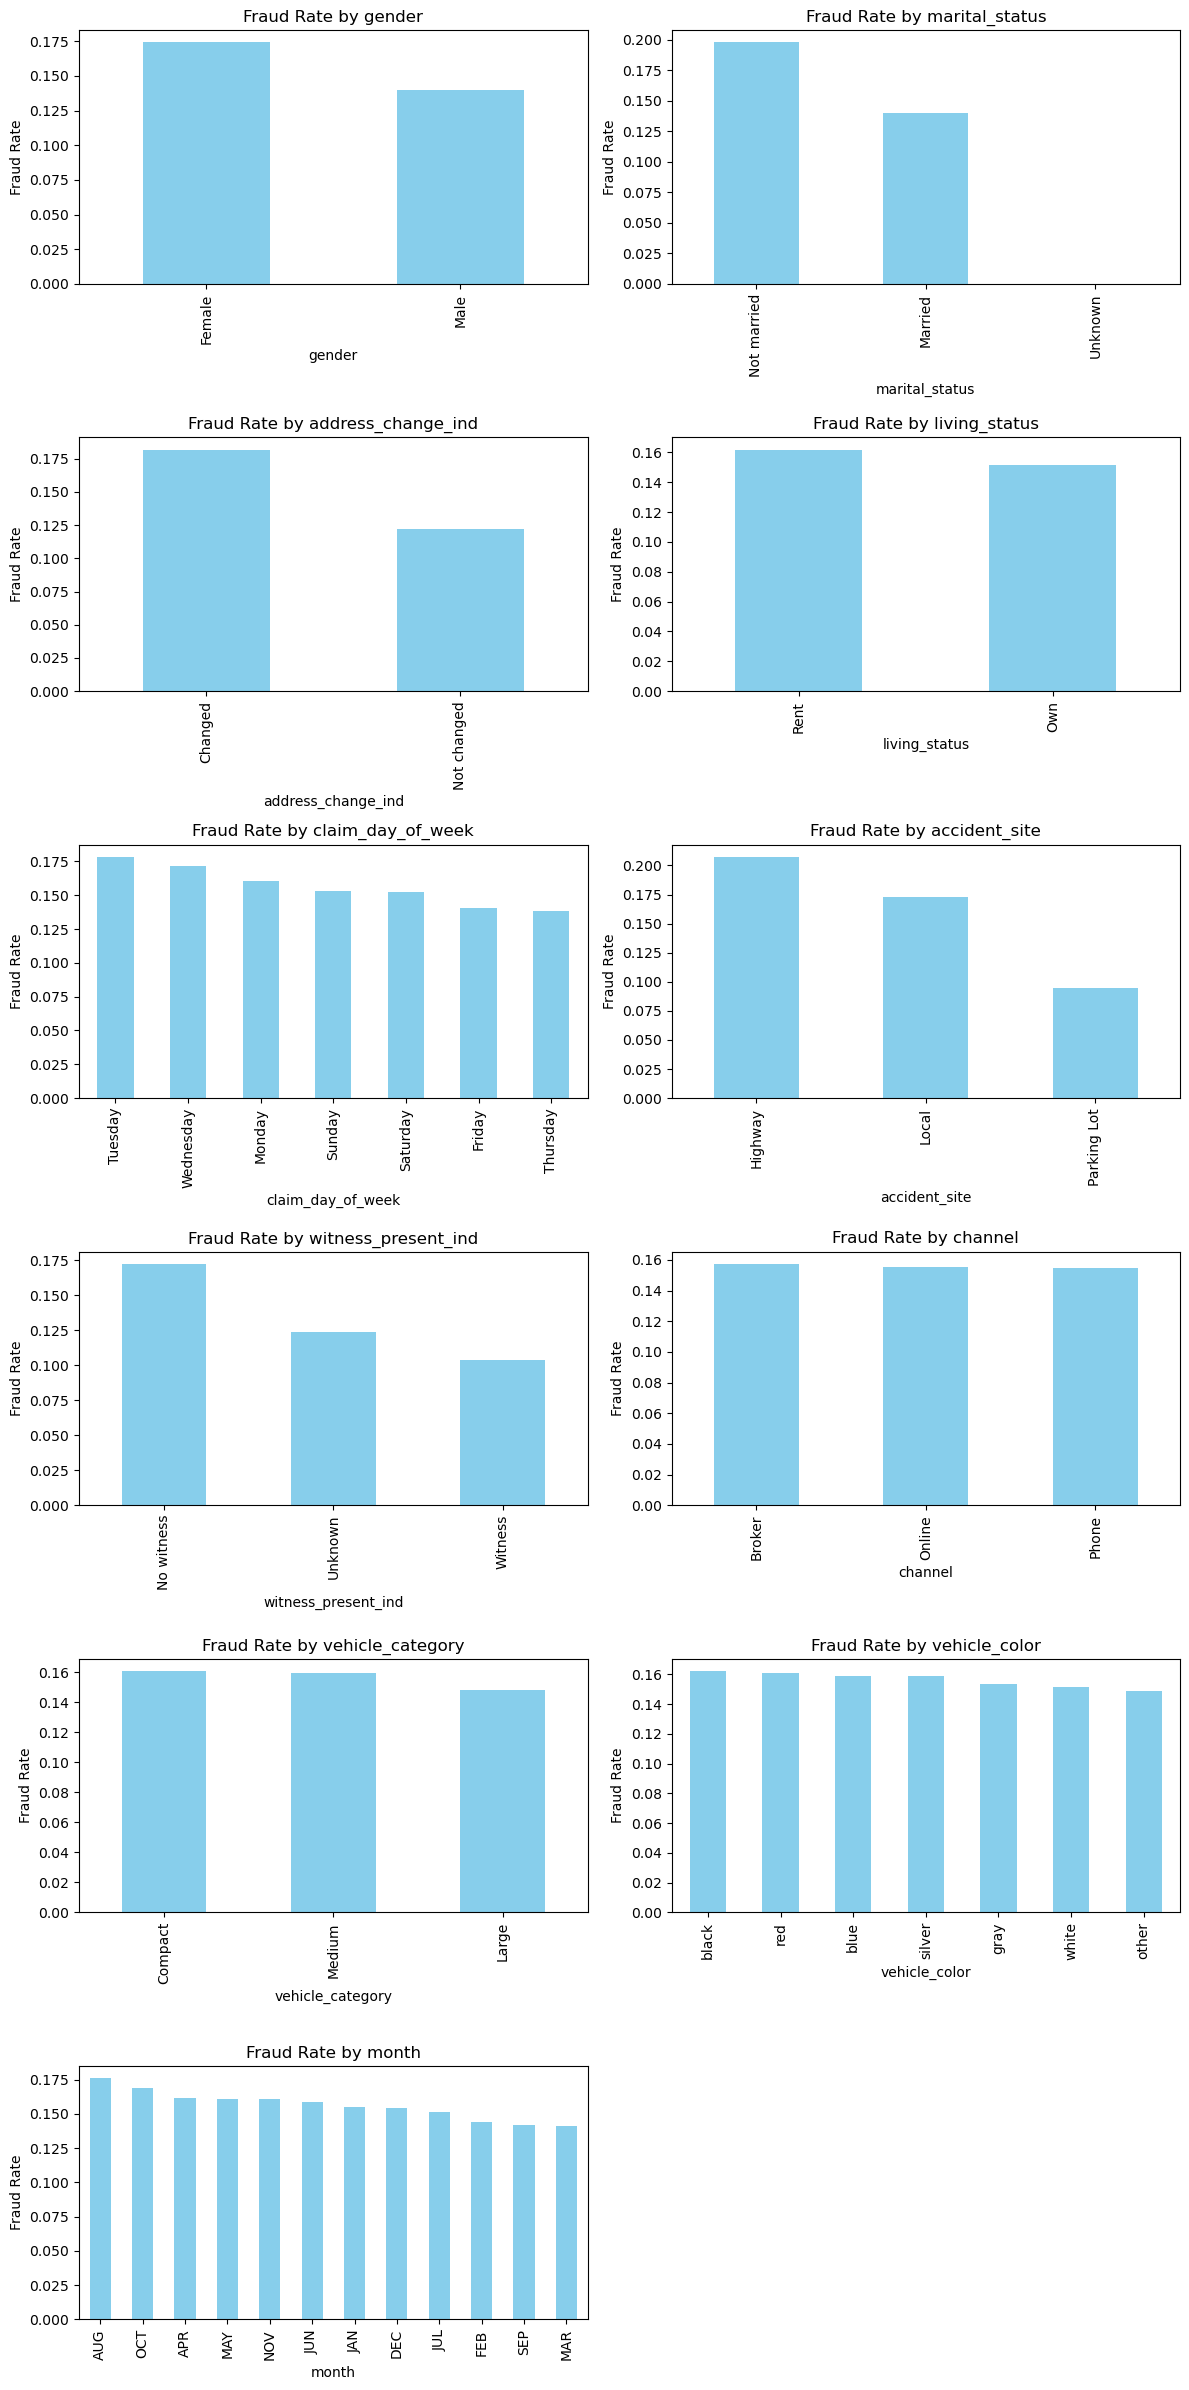
marital_status, address_change_ind, accident_site, channel 등의 변수는 사기 비율 차이가 뚜렷하다. 따라서 범주형 변수는 단순 빈도보다 사기율 차이에 초점을 맞춰 파생 변수를 설계할 필요가 있다.
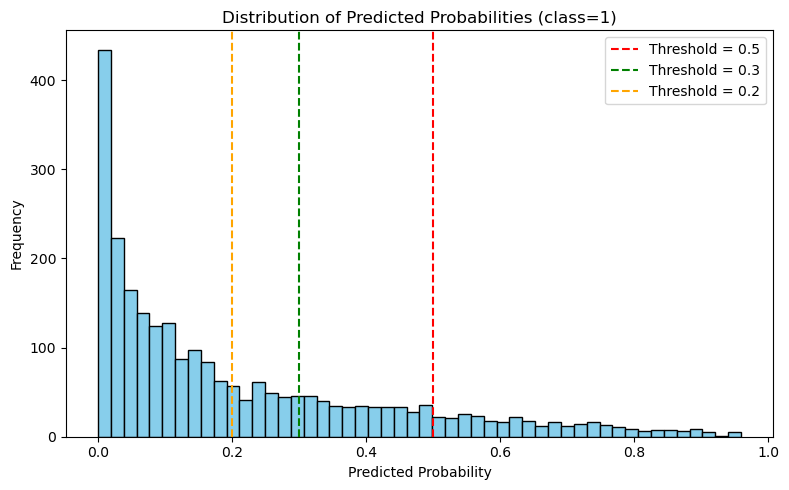
해당 플롯은 모델로부터 얻어진 class=1 의 확률 분포를 히스토그램 형태로 나타낸 것이다. 대다수의 샘플이 0.0 ~ 0.2 구간에 몰려 있으며, 사기라고 예측된 강한 신호는 상대적으로 드물며, 0.2, 0.3, 0.5의 세 가지 threshold를 기준으로 분포의 컷오프를 시각적으로 비교할 수 있도록 설정하였다.
- 0.5: Precision은 높지만 Recall이 낮음
- 0.3: 보다 균형 잡힌 전략
- 0.2: Recall을 극대화할 수 있음 (false positive 위험 존재)
위 플롯을 통해 클래스 불균형이 존재하는 상황에서 적절한 threshold 조정은 Precision-Recall trade-off를 제어하는 핵심 도구가 될 수 있음을 시사한다.
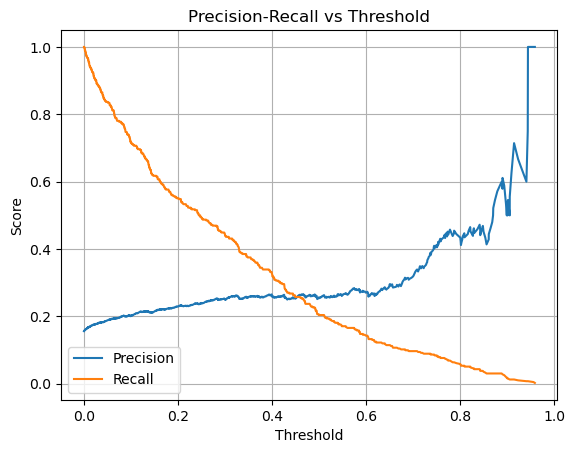
Threshold 변화에 따라 Precision과 Recall이 어떻게 변하는지를 나타낸 곡선이다.
- Threshold가 낮아질수록 Recall은 증가, Precision은 감소하는 전형적인 양상
- 대략 Threshold = 0.2~0.3 구간이 이상적인 F1 균형점
- 이 결과는 단순히 0.5로 고정된 기준을 사용할 경우 모델이 과도하게 보수적으로 판단할 수 있다는 점을 시사하며, 특이도 중심의 평가(예: Specificity 최적화)와 함께 threshold 조정이 매우 중요함을 보여준다.
Preprocessing and Feature Engineering
Data Cleansing
1
2
3
4
5
6
7
8
9
10
 train.drop('ID', inplace=True, axis=1)
test.drop('ID', inplace=True, axis=1)

...

drop_idx = train[train['age_of_driver'] < 19].index.to_list()
drop_idx.extend(train[train['annual_income'] < 0].index.to_list())
drop_idx.extend(train[train['marital_status'] == 'Unknown'].index.to_list())
train = train.drop(list(set(drop_idx)), axis=0)
train = train.dropna()
모델 학습에 영향을 주지 않는 ID컬럼을 제거하였으며, 기타 이상치 및 비정상 데이터는 총 데이터 대비 수가 매우 적어 제거하였다.
Feature Engineering
1
2
3
4
5
6
7
8
9
10
11
12
13
14
15
16
17
18
19
20
21
22
23
24
25
26
27
28
29
30
31
32
33
34
35
36
37
38
39
40
41
42
43
44
45
46
47
48
49
50
51
52
53
54
55
56
57
58
59
60
61
62
63
64
65
66
67
68
69
70
71
72
 #Feature Engineering
import numpy as np
from sklearn.preprocessing import LabelEncoder

def feature_engineering(df):
    log_scale = ['annual_income', 'vehicle_price', 'past_num_of_claims', 'claim_est_payout', 'liab_prct', 'vehicle_weight']
    for col in log_scale:
        df[col] = pd.to_numeric(df[col], errors='coerce')
        df[col] = df[col].fillna(0)
        df[f'log_{col}'] = np.log1p(df[col].clip(lower=0))

    # 수치형 비율 및 조합
    df['income_per_claim'] = df['annual_income'] / (df['claim_est_payout'] + 1e-3)
    df['claim_per_liab'] = df['claim_est_payout'] / (df['liab_prct'] + 1e-3)
    df['claim_income_ratio'] = df['claim_est_payout'] / (df['annual_income'] + 1e-3)
    df['claim_vehicle_ratio'] = df['claim_est_payout'] / (df['vehicle_price'] + 1e-3)
    df['vehicle_price_per_weight'] = df['vehicle_price'] / (df['vehicle_weight'] + 1e-3)
    df['price_income_ratio'] = df['vehicle_price'] / (df['annual_income'] + 1e-6)
    df['price_per_vehicle_age'] = df['vehicle_price'] / (df['age_of_vehicle'] + 1e-3)
    df['liability_claim_ratio'] = df['liab_prct'] / (df['claim_est_payout'] + 1e-3)
    df['liab_claim_product'] = df['liab_prct'] * df['claim_est_payout']
    df['claims_liab_interaction'] = df['past_num_of_claims'] * df['liab_prct']
    df['claims_vehicle_age_ratio'] = df['past_num_of_claims'] / (df['age_of_vehicle'] + 1e-3)
    df['driver_vehicle_age_diff'] = df['age_of_driver'] - df['age_of_vehicle']

    # 조건 기반 이진 변수
    df['is_young_driver'] = (df['age_of_driver'] < 25).astype(int)
    df['is_elder_driver'] = (df['age_of_driver'] > 65).astype(int)
    df['is_low_income'] = (df['annual_income'] < df['annual_income'].quantile(0.25)).astype(int)
    df['is_high_claim_ratio'] = (df['claim_per_liab'] > df['claim_per_liab'].quantile(0.75)).astype(int)
    df['is_weekend_claim'] = df['claim_day_of_week'].isin(['Saturday', 'Sunday']).astype(int)
    df['is_address_changed'] = (df['address_change_ind'] == 'Changed').astype(int)
    df['is_vehicle_old'] = (df['age_of_vehicle'] > 10).astype(int)

    # 위험 조건 조합
    df['multi_claim_low_income'] = ((df['past_num_of_claims'] > 2) &  (df['annual_income'] < df['annual_income'].median())).astype(int)
    df['unstable_renter'] = ((df['living_status'] == 'Rent') & (df['address_change_ind'] == 'Changed')).astype(int)
    df['no_witness_moved'] = ((df['witness_present_ind'] == 'No witness') & (df['address_change_ind'] == 'Changed')).astype(int)
    # 결측 여부 플래그
    df['missing_claim_est'] = df['claim_est_payout'].isnull().astype(int)
    df['missing_vehicle_age'] = df['age_of_vehicle'].isnull().astype(int)

    # 범주형 조합 변수
    df['site_witness_combo'] = df['accident_site'].astype(str) + '_' + df['witness_present_ind'].astype(str)
    df['channel_day_combo'] = df['channel'].astype(str) + '_' + df['claim_day_of_week'].astype(str)
    df['channel_witness_combo'] = df['channel'].astype(str) + '_' + df['accident_site'].astype(str)
    df = pd.get_dummies(df, columns=['site_witness_combo', 'channel_day_combo', 'channel_witness_combo'])

    #범주화
    df['driver_age_group'] = pd.cut(df['age_of_driver'], bins=[0, 20, 30, 40, 50, 100], labels=['teen', '20s', '30s', '40s', '50_plus'])
    df['vehicle_age_group'] = pd.cut(df['age_of_vehicle'], bins=[0, 3, 7, 12, 20, 100], labels=['very_new', 'new', 'used', 'old', 'very_old'])
    df['vehicle_price_group'] = pd.cut(df['vehicle_price'], bins=[0, 20000, 40000, 80000, 1e9], labels=['below_20000', '20000_40000', '40000_80000', 'above_80000'])
    df['income_level'] = pd.cut(df['annual_income'], bins =[25000, 30000, 35000, 40000, 50000] , labels=['low_income', 'mid_income', 'high_income', 'super_high'])
    df = pd.get_dummies(df, columns=['driver_age_group', 'vehicle_age_group', 'vehicle_price_group', 'income_level'], drop_first=True)

    #상호작용 변수
    df['high_edu_claim'] = df['high_education_ind'] * df['claim_est_payout']
    df['multiple_claims'] = df['past_num_of_claims'] * df['claim_est_payout']

    #시간 기반 특성
    df['is_weekend'] = df['claim_day_of_week'].isin(['Saturday', 'Sunday']).astype(int)
    df['is_year_end'] = df['month'].isin(['November', 'December']).astype(int)
    df['is_month_begin'] = df['day'] <= 7
    df['season'] = df['month'].map({
        'December': 'Winter', 'January': 'Winter', 'February': 'Winter',
        'March': 'Spring', 'April': 'Spring', 'May': 'Spring',
        'June': 'Summer', 'July': 'Summer', 'August': 'Summer',
        'September': 'Fall', 'October': 'Fall', 'November': 'Fall'
    })
    df = pd.get_dummies(df, columns=['season'], drop_first=True)

    return df
학습과 테스트 데이터 셋에 동일하게 적용할 수 있도록 모든 피처 엔지니어링 작업은 featureengineering() 함수로 구현하고 일괄로 적용하였다. 세부 작업 사항은 다음과 같다.
| 항목 | 적용 기법 |
|---|---|
| 결측치 처리 | 비정상 레코드 제거, 결측 플래그 생성 |
| 이상치 대응 | 로그 변환 (log1p) |
| 수치형 확장 | 비율 기반 피처, 조합 파생 변수 |
| 범주형 확장 | 범주형 결합, 구간화 후 One-Hot Encoding |
| 시간 기반 확장 | 요일, 월, 계절, 연말 플래그 등 |
단순한 변수 확장을 넘어 위험 행동 패턴, 조합 리스크, 경제적 비정상성을 드러낼 수 있는 다양한 설계 전략을 포괄하여 최종 모델의 예측 성능 향상에 지대하게 기여했다.
Modeling strategy
Problem Characteristics and Metric Selection
본 과제는 이진 분류(binary classification) 문제로, 보험 청구 건이 사기(fraud) 인지 아닌지를 예측하는 것이 목적이다. 그러나 일반적인 분류 문제와는 달리, 이 문제는 다음과 같은 특수성을 가진다.
- 클래스 불균형(Class Imbalance): Fraud 비율이 약 15.6%에 불과하여, 단순 정확도(accuracy)만으로는 모델의 성능을 적절히 평가할 수 없다.
- 실무적 요구: 보험사 입장에서 정상 청구를 잘 맞추는 것(Specificity) 또한 중요하며, 거짓 양성(False Positive)을 줄이려는 목적도 병행된다.
따라서, 주요 평가 지표로는 다음을 사용하였다.
- F1 Score (macro) : 전체 균형 성능
- ROC-AUC : 전체적인 분류 민감도
- Specificity : 정상 예측의 정확성
- Precision-Recall Trade-off : threshold 조정을 통한 제어 가능성
Model Selection and Justification
| 모델 | 설명 |
|---|---|
| XGBoost | 강력한 앙상블 트리 모델로 불균형 데이터 대응에 효과적 |
| CatBoost | 범주형 변수 자동 처리, GPU 최적화 가능 |
| LightGBM | 대규모 데이터셋에 강하고 학습 속도 빠름 |
모델 선정의 주요 고려 사항은 다음과 같다:
- 트리 기반 모델은 복잡한 비선형 관계를 잘 학습하며,
- 결측치 및 범주형 처리에서 유리하고,
- 불균형 클래스에 민감한 loss나 가중치 설정이 가능하다.
Train/Validation Split Strategy
1
2
3
4
5
 from sklearn.model_selection import train_test_split

X = FE_train.drop(columns='fraud')
y = FE_train['fraud']
train_X, valid_X, train_y, valid_y = train_test_split(X, y, test_size=0.2, stratify=y, random_state=42)
전체 데이터셋은 8:2로 분할되었으며, 클래스 분포를 유지하기 위해 stratify 파라미터를 사용하였다. 이후 하이퍼파라미터 튜닝과 threshold 조정에는 검증 데이터셋을 기준으로 성능을 측정하였다.
Class Imbalance Handling
상술하였듯 별도의 오버샘플링은 사용하지 않고, 다음 전략을 활용하였다.
- Threshold 조정: Precision-Recall 그래프 기반으로 0.2~0.3 구간을 조정 대상으로 설정
- Class weight 설정 (모델 내부적으로 지원되는 경우)
- F1-macro 최적화: Optuna 기반 튜닝에서 목적 함수를 F1 macro로 설정하여 균형 성능 확보
Model Explainability (SHAP Values)
모델의 예측 근거를 설명하기 위해 SHAP 값을 사용하여 변수 중요도를 시각화 하였다. 각 모델의 SHAP summary plot 및 decision plot을 도출하여, 전체 피처의 영향력과 개별 예측의 구성 요소를 분석하였다.
XGBoost
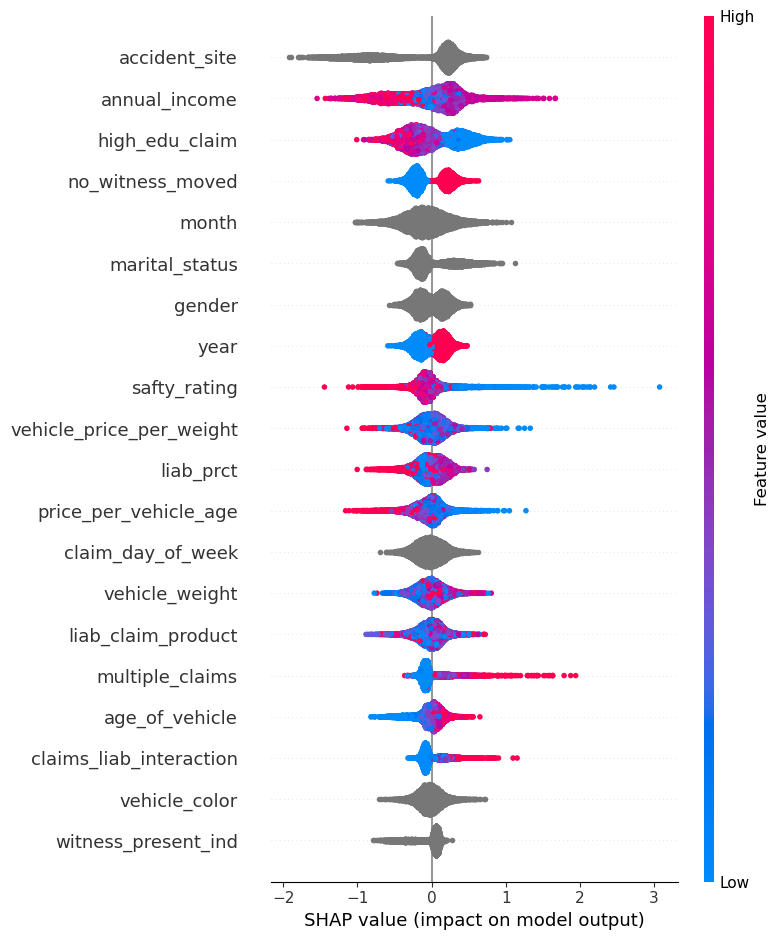
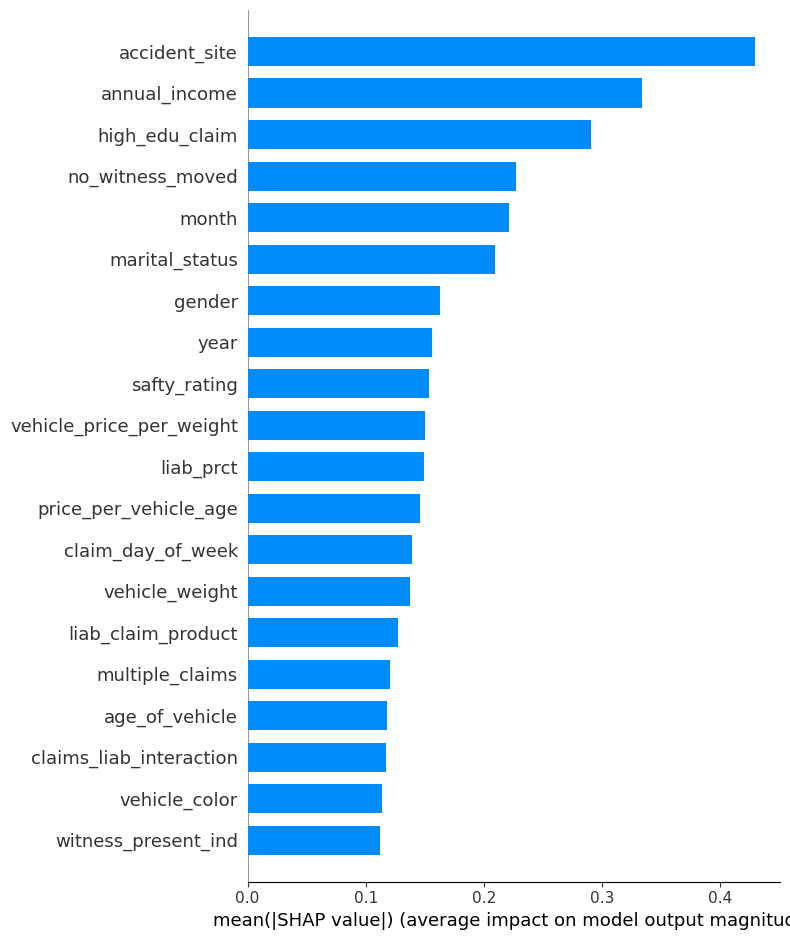

특정 예측에서는 accident_site = Highway, claims_liab_interaction, low education, female, no_witness_moved 등 요소가 Fraud 방향으로 강하게 기여하였다.
CatBoost
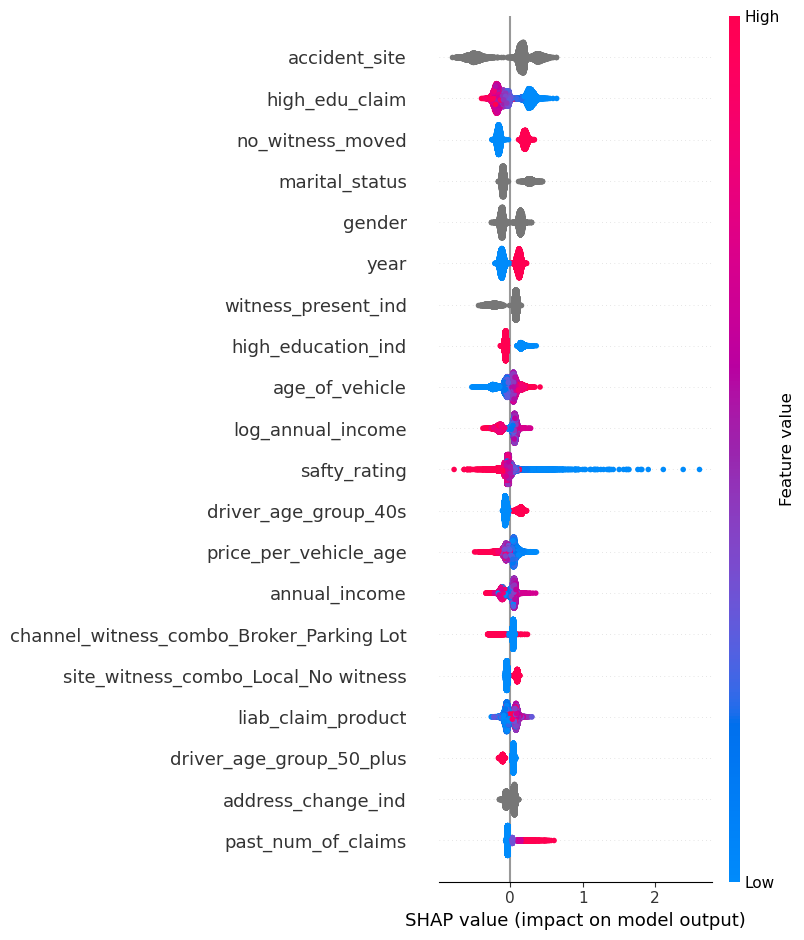
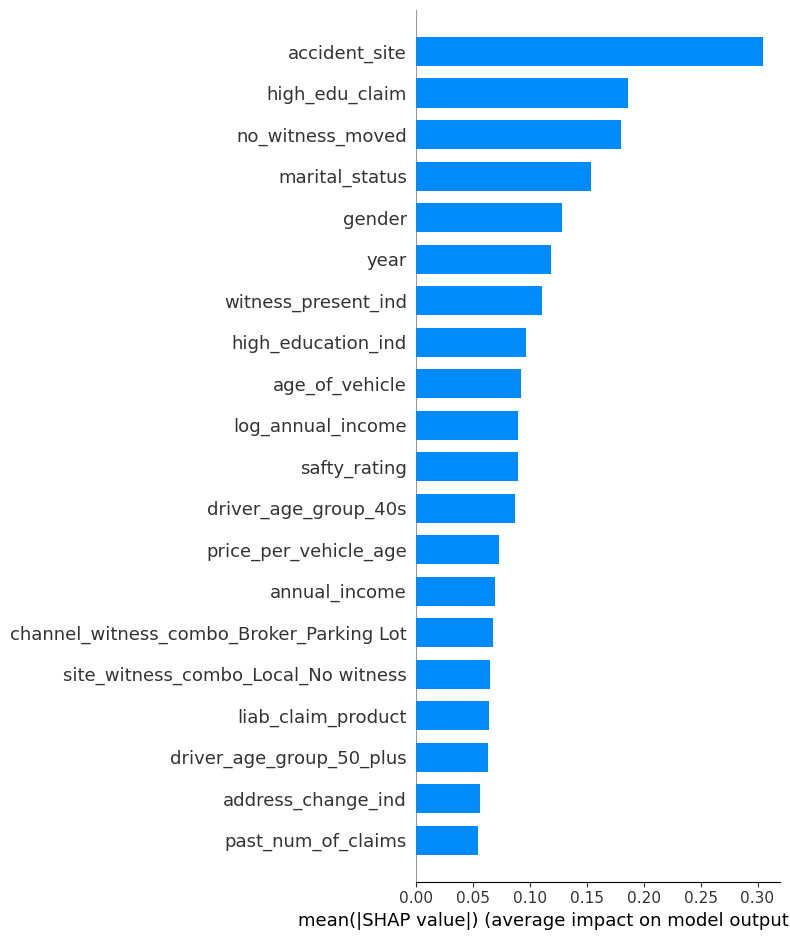

이 예측에서는 accident_site = Highway, not married, safty_rating = 매우 낮음 등의 특징이 Fraud 방향으로 강하게 기여하였다.
LightGBM
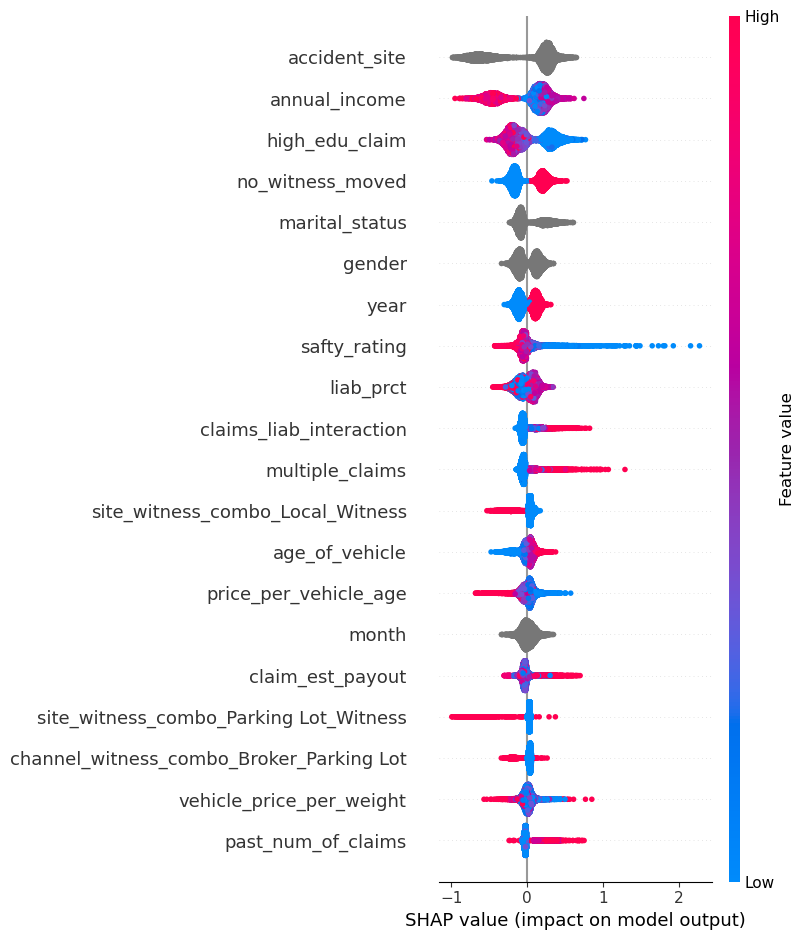
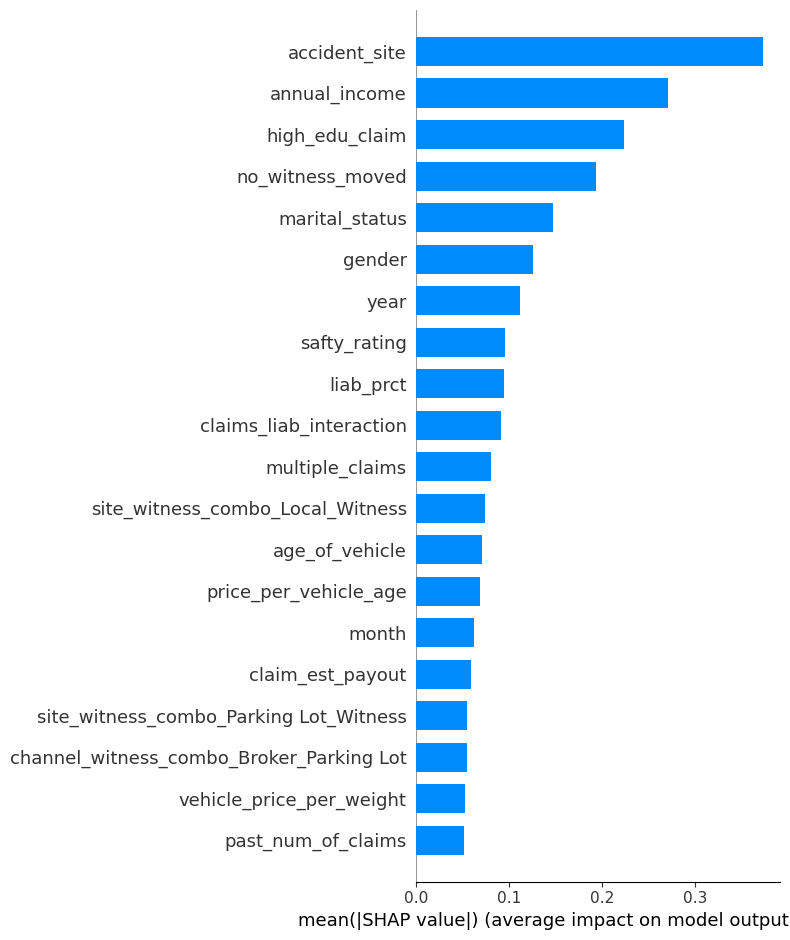

교육 수준이 낮고(high_edu_claim = 0), 보험금이 높으며, 책임 비율이 과도한 경우에 Fraud로 분류되는 패턴이 나타났다.
SHAP 분석을 통해 모델이 단순한 패턴이 아닌 다차원적 피처 상호작용과 도메인 기반 조합 변수들에 반응하고 있음을 확인하였으며, 이는 피처 엔지니어링 단계에서 설계한 전략들이 모델 내부에서 의미있게 작용했음을 의미한다.
최종적으로는 SHAP 분석을 통해 도출해낸 상위 30개의 피처 중 공통된 피처들만을 학습에 사용하였다.
Voting Ensemble Strategy
1
2
3
4
5
6
7
8
9
10
11
12
13
14
15
16
17
18
19
20
21
22
 def tune_threshold_xgb(model, X_val, y_val, thresholds=np.arange(0.1, 0.61, 0.02)):
    best_thresh = 0
    best_f1 = 0
    for threshold in thresholds:
        probs = model.predict_proba(X_val)[:, 1]
        preds = (probs >= threshold).astype(int)
        macro_f1 = f1_score(y_val, preds, average='macro')
        print(f"Threshold = {threshold:.2f} | Macro F1-score = {macro_f1:.4f}")

        if macro_f1 > best_f1:
            best_f1 = macro_f1
            best_thresh = threshold

    print(f"\nBest Threshold: {best_thresh:.2f} | Best Macro F1-score: {best_f1:.4f}")

    final_preds = (model.predict_proba(X_val)[:, 1] >= best_thresh).astype(int)
    print("\nClassification Report:")
    print(classification_report(y_val, final_preds))

    return best_thresh, best_f1

best_thresh_xgb, best_f1_xgb = tune_threshold_xgb(model_xgb, valid_X, valid_y)
위 코드를 통해 모델별 최적의 threshold를 탐색하여 그 결과를 기반으로 Soft Voting 앙상블을 구성하였다. 각 모델은 검증 데이터셋의 F1 성능을 기반으로 가중치를 설정하였다.
1
2
3
4
5
6
7
8
9
10
11
12
13
14
15
16
17
18
19
20
21
22
23
24
25
26
27
28
29
30
31
32
33
34
 def weighted_soft_voting_threshold(models, weights, thresholds, X_val, y_val):
    probas = np.zeros(len(y_val))
    for name, model in models.items():
        p = model.predict_proba(X_val)[:, 1]
        t = thresholds[name]
        probas += weights[name] * (p >= t).astype(float)

    preds = (probas >= 0.5).astype(int)
    f1 = f1_score(y_val, preds, average='macro')

    print(f"\n[Weighted Soft Voting] Macro F1-score: {f1:.4f}")
    print(classification_report(y_val, preds))

    return preds, f1

models = {
    "XGB": model_xgb,
    "Cat": model_cat,
    "LGBM": model_lgbm
}

weights = {
    "XGB": 0.37,
    "Cat": 0.30,
    "LGBM": 0.33
}

thresholds = {
    "XGB": 0.36,
    "Cat": 0.24,
    "LGBM": 0.26
}

final_preds, final_f1 = weighted_soft_voting_threshold(models, weights, thresholds, valid_X, valid_y)
이 구조는 개별 모델의 예측 분산을 줄이고 전체적인 강건성을 확보하였다.
Fitting and Tuning
Hyperparameter Optimization Strategy
1
2
3
4
5
6
7
8
9
10
11
12
13
14
15
16
17
18
19
20
21
22
23
24
25
26
27
 def objective_lgbm(trial):
    params = {
        "n_estimators": trial.suggest_int("n_estimators", 100, 500),
        "max_depth": trial.suggest_int("max_depth", 3, 10),
        "learning_rate": trial.suggest_float("learning_rate", 0.01, 0.3),
        "num_leaves": trial.suggest_int("num_leaves", 7, 127),
        "min_child_samples": trial.suggest_int("min_child_samples", 10, 100),
        "subsample": trial.suggest_float("subsample", 0.6, 1.0),
        "colsample_bytree": trial.suggest_float("colsample_bytree", 0.6, 1.0),
        "reg_alpha": trial.suggest_float("reg_alpha", 0, 5),
        "reg_lambda": trial.suggest_float("reg_lambda", 0, 5),
        "random_state": 42,
        "n_jobs": -1
    }

    model = LGBMClassifier(**params)
    model.fit(train_X, train_y)
    preds = model.predict(valid_X)
    f1 = f1_score(valid_y, preds, average="macro")
    return f1

study = optuna.create_study(direction="maximize")
study.optimize(objective_lgbm, n_trials=30)

print("Best Params:", study.best_params)
print("Best Macro F1:", study.best_value)
모델 성능을 극대화하기 위해 Optuna 프레임워크를 활용하여 각 모델의 하이퍼파라미터를 최적화 하였다. 튜닝의 목적은 단순 성능 뿐 아니라, 불균형 데이터에 강인한 분류기 구조 설계와 과적합 억제를 목표로 하였다. 모델 예측 후 확률값을 기준으로 사기 여부를 이진 분류할 때, 단순히 threshold=0.5를 사용하는 대신 검증 데이터셋 기반 Precision-Recall 곡선 분석을 통해 최적 임계값을 도출하였다.
1
2
3
4
5
6
 probas = (
    0.37 * model_xgb.predict_proba(X_test)[:, 1] >= 0.36 +
    0.30 * model_cat.predict_proba(X_test)[:, 1] >= 0.24 +
    0.33 * model_lgbm.predict_proba(X_test)[:, 1] >= 0.33
)
final_preds = (probas >= 0.5).astype(int)
Evaluation and Analysis
Model Performance Evaluation Metrics
최종 예측 결과에 대한 정량적 평가를 위해 다양한 성능 지표를 측정하였다. 특히나 타겟 클래스가 전체의 약 15% 가량에 불과한 불균형성을 띄고 있으므로, 단순한 정확도가 아닌 Recall, Precision, F1 Score, Specificity 등 다양한 지표를 종합적으로 고려하였다.
| 지표 | 설명 |
|---|---|
| Precision | 사기 예측 중 실제 사기일 확률 (False Positive 최소화에 기여) |
| Recall | 실제 사기 중 탐지한 비율 (False Negative 최소화에 기여) |
| F1 Score (Macro) | 클래스 불균형을 고려한 전체 모델 균형 평가 |
| Accuracy | 전체 정답 비율 (보조적인 참고 지표) |
| Specificity | 정상 클래스(0)에 대해 올바르게 예측한 비율= TN / (TN + FP) |
Confusion Matrix : Before and After
모델 성능 향상을 직관적으로 보여주기 위해, 모델 최적화 전과 후의 혼동 행렬을 비교하였다.
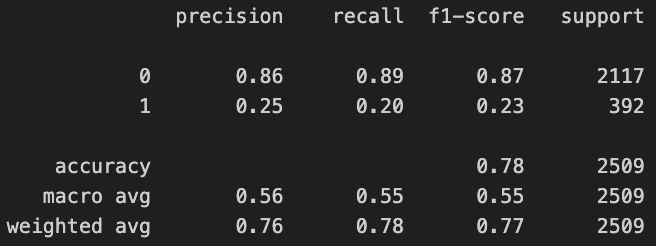
Class 1(Fraud)의 Precision: 0.25 / Recall: 0.20 / F1: 0.23 Accuracy는 0.78이나, 이는 대부분이 정상이기 때문에 발생한 착시이며 사기 탐지 측면에서는 실질적으로 활용이 어려운 성능 수준이라고 볼 수 있다.
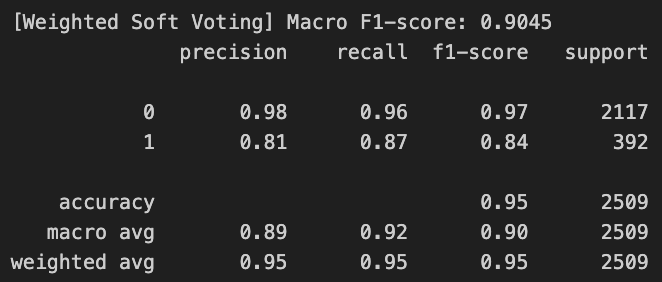
Class 1(Fraud)의 Precision: 0.81 / Recall: 0.87 / F1-score: 0.84 Macro 평균 F1 Score는 0.90 이상으로, 클래스 간 균형 잡힌 분류 성능을 확보하였으며 Accuracy 또한 0.95로 증가하며 전반적인 예측 품질 향상을 확인하였다.
본 평가 결과는 threshold 조정, Optuna 기반 튜닝, soft voting 앙상블 전략이 불균형 문제에 효과적으로 작용했음을 실증적으로 보여준다. 특히 Recall과 F1 Score의 개선은 실제 사기 탐지 목적에 매우 부합한다.
Key Observations
- Recall 개선: baseline 대비 class 1의 recall이 0.20 → 0.87로 대폭 향상되었음 → 사기 탐지 능력 실질적 확보
- Precision 향상: 모델 threshold 조정 및 앙상블로 False Positive 억제 성공
- Specificity 보존: class 0의 예측 정확도(0.96)는 여전히 높게 유지됨 → 실무에서의 오탐 부담 최소화
- F1 Score 균형화: class imbalance에 민감한 F1 macro 기준에서도 안정적 모델 구조 확보
Conclusion
본 프로젝트는 보험 청구 데이터 기반의 자동 사기 탐지 시스템 개발을 목표로 하였으며, 다음과 같은 전략을 통해 성과를 도출하였다:
- 데이터 전처리 및 고도화된 피처 엔지니어링
- 로그 변환, 비율 기반 파생 변수, 다중 범주 조합 등의 설계를 통해 핵심 변수 구조 강화
- 시간, 경제적, 행동적 특성을 모두 반영하는 파생 변수 설계
- 트리 기반 모델 앙상블 및 튜닝 최적화
- XGBoost, LightGBM, CatBoost를 활용하여 앙상블 구성
- Optuna 기반 하이퍼파라미터 튜닝 + 모델별 threshold 조정 적용
- 모델 해석 가능성 확보 및 실제 효과 평가
- SHAP 분석을 통해 주요 영향 변수 도출
- 성능 향상 전후 비교(Class 1의 F1: 0.23 → 0.84, Macro F1: 0.55 → 0.90)를 통해 실질적인 개선 확인
- 정확도뿐 아니라 실무 적용에 중요한 Recall / Specificity / F1을 균형적으로 개선
- Recall (fraud): 0.20 → 0.87
- Specificity (normal): 0.89 → 0.96
결과적으로, 단순 정확도 개선이 아닌 실질적 사기 탐지율 향상과 정상 탐지 안정성 확보라는 두 가지 과제를 모두 달성하였으며, 해커톤 또한 우수한 성적으로 마무리 하였다.
